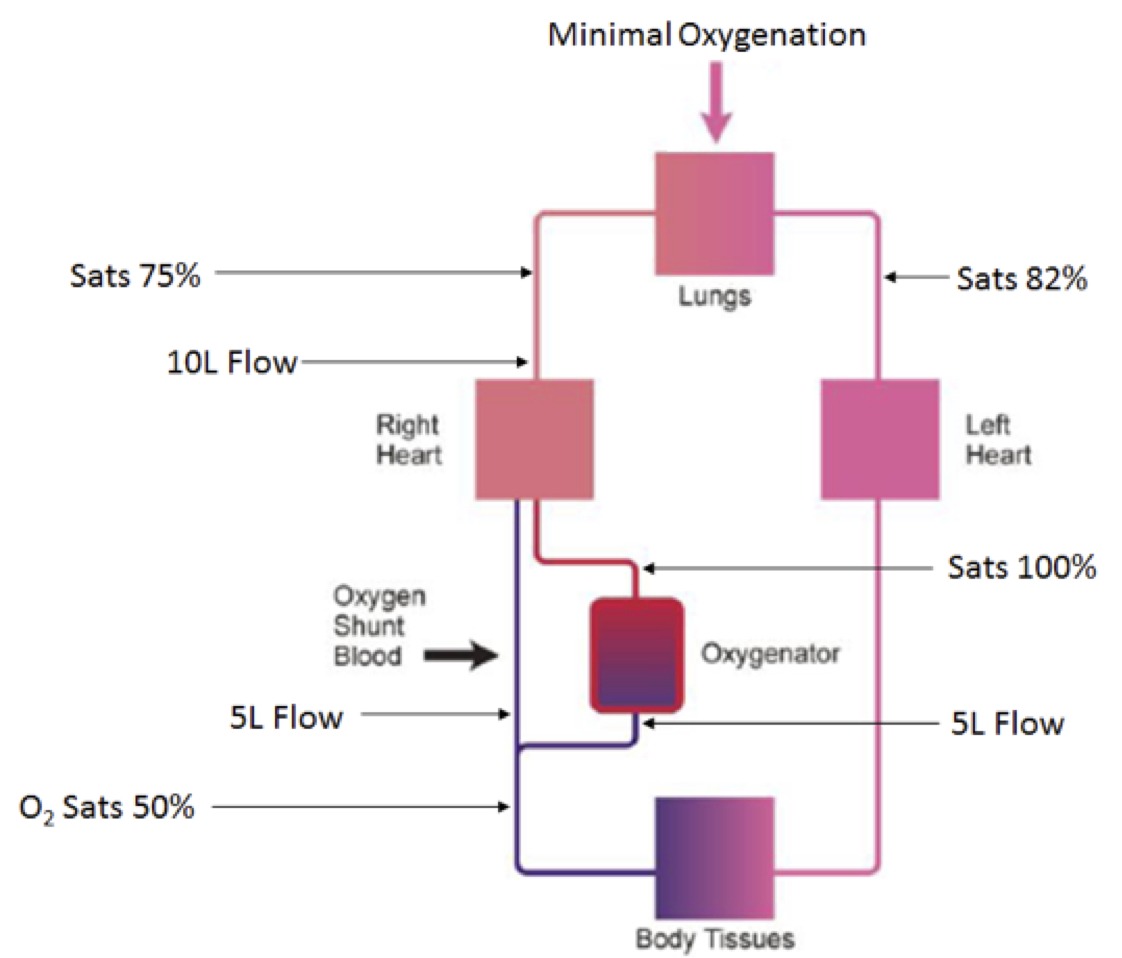
Figure 1. Schematic diagram describing the degree of blood oxygenation at different site’s of the patient’s circulation while on VV ECMO.
Figure 1. Schematic diagram describing the degree of blood oxygenation at different site’s of the patient’s circulation while on VV ECMO.