Author: Jake Barlow
Reviewer: Chris Nickson
Journal Club 016
Ioannidis JP. Why most published research findings are false. PLoS Med. 2005 Aug;2(8):e124. Epub 2005 Aug 30. PubMed PMID: 16060722; PubMed Central PMCID: PMC1182327.
‘Why most published research findings are false’ is an opinion piece written by physician Professor John Ioannidis, who is current Professor of Health Research and Policy at the Stanford School of Medicine. From his previous work, it can be seen that he has an established interest in research standards and methods, and is one of the cofounders of the Meta-Research Innovation Center at Stanford (METRICS).
The paper was published in PLoS Medicine which is an open-access, peer-reviewed journal, with a pay-to-publish model. Given its provocative title and rather anti-establishment tone, it would be interesting to know if it had been rejected from general medical journals – given its business model PLoS has a (perhaps undeserved) reputation as being “peer-review lite” and is considered by some to be a lower-tier journal as a consequence. Given PLoS was in its infancy at the time this article was published, such sentiments may have been stronger at the time. Regardless, the article has had substantial impact and is the most-viewed paper of any PLoS publication.
This work was published almost a decade ago (2005), which is relevant when appraising it now as there has been work done in the intervening decade to address some of the concerns raised in this paper. The central thesis however is still very relevant, and worthy of discussion.
The piece asserts there are three main causes of incorrectly rejecting the null hypothesis, or having a type I error. The first and probably best recognised (but still poorly understood) is the p-value. At a given significance level (alpha), we say that the null hypothesis is rejected and subsequently choose to accept the alternative hypothesis. This is an oversimplification of the properties of a p-value that has led to p-values being put on a pedestal and interpreted inappropriately. This is improving, but statistics is an abstract and complicated field, and statistical literacy is not universal.
As would be expected, changing the significance level, e.g. reducing the α from 0.05 to 0.01 reduces our Type I error rate. Note, however, the significance level is not the type I error rate – they are only equivalent if the null hypothesis is actually true. Similarly, a p-value of 0.05 does not mean the null hypothesis has a 5% chance of being true, merely that this data is consistent with a 5% chance of the null hypothesis being true.
A less intuitive cause of Type I errors is statistical power. Power is defined as 1 – β, where β is the probability of a type II error. Increasing the power will obviously decrease the type II error rate, however power also demonstrates a logistic relationship with prior probability and the false-positive probability. Figure 1 (from Wacholder et al, 2004) demonstrates this logistic relationship for a variety of values for power where α is fixed at 0.05.
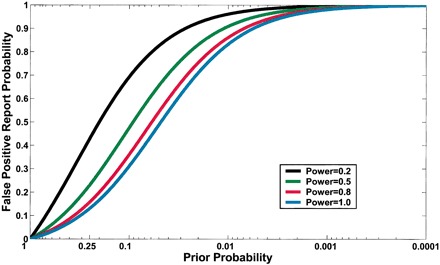
From Wacholder et al, 2004 (Click image for source)
The third reason, and the main focus for this paper, is the pre-study probability that the alternative hypothesis is actually true. This uses a Baysean rather than frequentist approach to probability. To demonstrate this relationship, Ioannadis has developed an R value, which is the ratio between the number of true relationships investigated to the number of false relationships investigated in a field study. This is probably best employed as a way of illustrating the concept, rather than as a formal tool. Therefore, the pre-study probability of a study in this field being true is R/(R+1). The post-study probability of the alternative hypothesis being correctly selected is not related only to passing a significance test, but also the pre-study probability. If a biologically implausible relationship passes a significance test, which is more likely – that the relationship is correct or there is some error (either random or systemic) in the collection and analysis of the data?
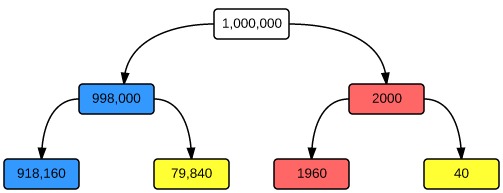
This is somewhat conceptually complex, but an easy analysis can be drawn with example of a screening test. Suppose we wish to screen for SLE in the general population using ANA. This is a (perhaps surprisingly) good test, with a sensitivity of 98% and a specificity of 92% for a titre >1:80 (Wichainun et al, 2012). The population prevalence (pre-test probability) of lupus is very low, about 20/10,000 (Schur et al, 2013). In a sample of 1,000,000 individuals drawn from the general population, only 2,000 will actually have lupus. Testing ANA titres in this population will result in 1960 true positives (with only 40 false-negatives), but an overwhelming 79,840 false-positives. The positive predictive value is therefore 0.024 and the test is useless – the pre-test probability is just too low to get any useful information.
For the second test, let us take our random sample from females attending the rheumatology outpatients clinic with fatigue, malar rash, photosensitivity, fever, and a polyarthropathy. In this population, the prevalence will be significantly higher (let’s assume 4000/10,000, or 40%), so the pre-test probability that any one individual will have the condition is higher.
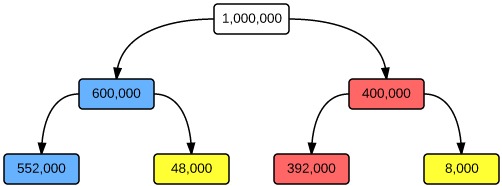
Performing the same test in this population gives 392,000 true positives for every 48,000 false positives, a positive predictive value of 0.89. The test is now useful – a member of this population with a positive ANA has an 89% chance of having the disease.
This illustrates the importance of pre-study probability when interpreting the findings of a study. In Ioannidis’s system, R/(R+1) is the pre-study odds. The R value is a useful way of conceptualising pre-study probability, and is peculiar to the field of research and the study being conducted. It stands to reason that if investigating a relationship where no true relationship exists, any significant result is a type I error. A well-conducted, adequately powered randomised controlled trial investigating the effects of the transit of Venus on the incidence of autism will always result in a type I error – there is no biological plausibility for this relationship.
The R value does not account for effects of bias. Ioannidis compensates for this by introducing a u value, which calculates the effect of increasing bias on the positive predictive value. Similar to the R value, this is likely best employed as an illustration of the concept rather as a formal proof.
Ioannidis draws six conclusions (“corollaries”) from this modelling. The first two – that smaller studies and smaller effect sizes decrease the likelihood that a studies findings are true – are almost self-evident. Both decreased sample size and decreased effect sizes decrease the power of a study, which as shown earlier results in an increased Type I error rate. That the greater number of relationships tested in the study also increases the Type I error rate is also intuitive, as this will decrease the R value and increase the false positive rate. Flexible research designs and definitions allow massaging of results to generate significant outcomes, and so facilitate bias. It is this authors opinion that composite end points of objective and subjective variables can also introduce bias through this mechanism. Conflicts of interest and financial pressures also have potential to generate bias. The last corollary – that the ‘hotter’ a scientific field is the greater the chance of false-positive results is more a consequence of human nature rather than a statistical anomaly. When a topic is in vogue, there is a time pressure on publication which encourages publication of underpowered, surprising results.
Ioannidis comes to the conclusion that “Most research findings are false for most research designs and for most fields.” As can be demonstrated the framework described above, attaining even borderline post-study probabilities (PPV>0.5) is exceedingly difficult.
It is an unfortunate reality that it is impossible to know with certainty the answer to any particular research question. The alternative hypothesis is never accepted, only the null hypothesis is rejected. However, we can improve the chance of rejecting the null hypothesis appropriately. One mechanism is increasing the power. This has the consequence of being expensive (by increasing sample size), or missing weaker relationships (by increasing effect size), and also (as can be seen in the earlier graphs) follows the law of diminishing returns. Results should not be considered in isolation, and must be interpreted in context of the nature of the trial, the field in which they’re performed, and the totality of the evidence. Improving research standards will also help minimise bias, and improve the utility of these study designs.
References and links
- Nickson CP. Dogma and Pseudoaxioms. LITFL Critical Care Compendium. [Accessed 10 February 2015 at URL: http://lifeinthefastlane.com/ccc/dogma-and-pseudoaxioms/]
- Nickson CP. Medical Reversal. LITFL Critical Care Compendium. [Accessed 10 February 2015 at URL: http://lifeinthefastlane.com/ccc/medical-reversal/]
- Schur PH et al. Epidemiology and pathogenesis of systemic lupus erythematosus. In UpToDate TW (Last updated Sep 15, 2014). Maltham, WA. Accessed 8/12/2014.
- Wacholder S, Chanock S, Garcia-Closas M, El Ghormli L, Rothman N. Assessing the probability that a positive report is false: an approach for molecular epidemiology studies. J Natl Cancer Inst. 2004 Mar 17;96(6):434-42. PubMed PMID: 15026468. [Free Full Text]
- Wichainun R, Kasitanon N, Wangkaew S, Hongsongkiat S, Sukitawut W, Louthrenoo W. Sensitivity and specificity of ANA and anti-dsDNA in the diagnosis of systemic lupus erythematosus: a comparison using control sera obtained from healthy individuals and patients with multiple medical problems. Asian Pac J Allergy Immunol. 2013 Dec;31(4):292-8. doi: 10.12932/AP0272.31.4.2013. PubMed PMID: 24383972. [Free Full Text]